AI Learning Centres:
- AI – Learn The Basics
- Get The Most From ChatGPT
- Branding in The Age of AI
- AI for Client Experience
- AI For Prospecting
- AI For Marketing
- AI For Listings & Ads
- Team Adoption of AI
- AI For PM
- AIO & Generative Search
- AI For Operations & Efficiency
- AI For Market Research & Analysis
- AI Ethics, Privacy & Compliance in Real Estate
Digital Marketing & Social Media Learning Centres:
Guides & Downloads
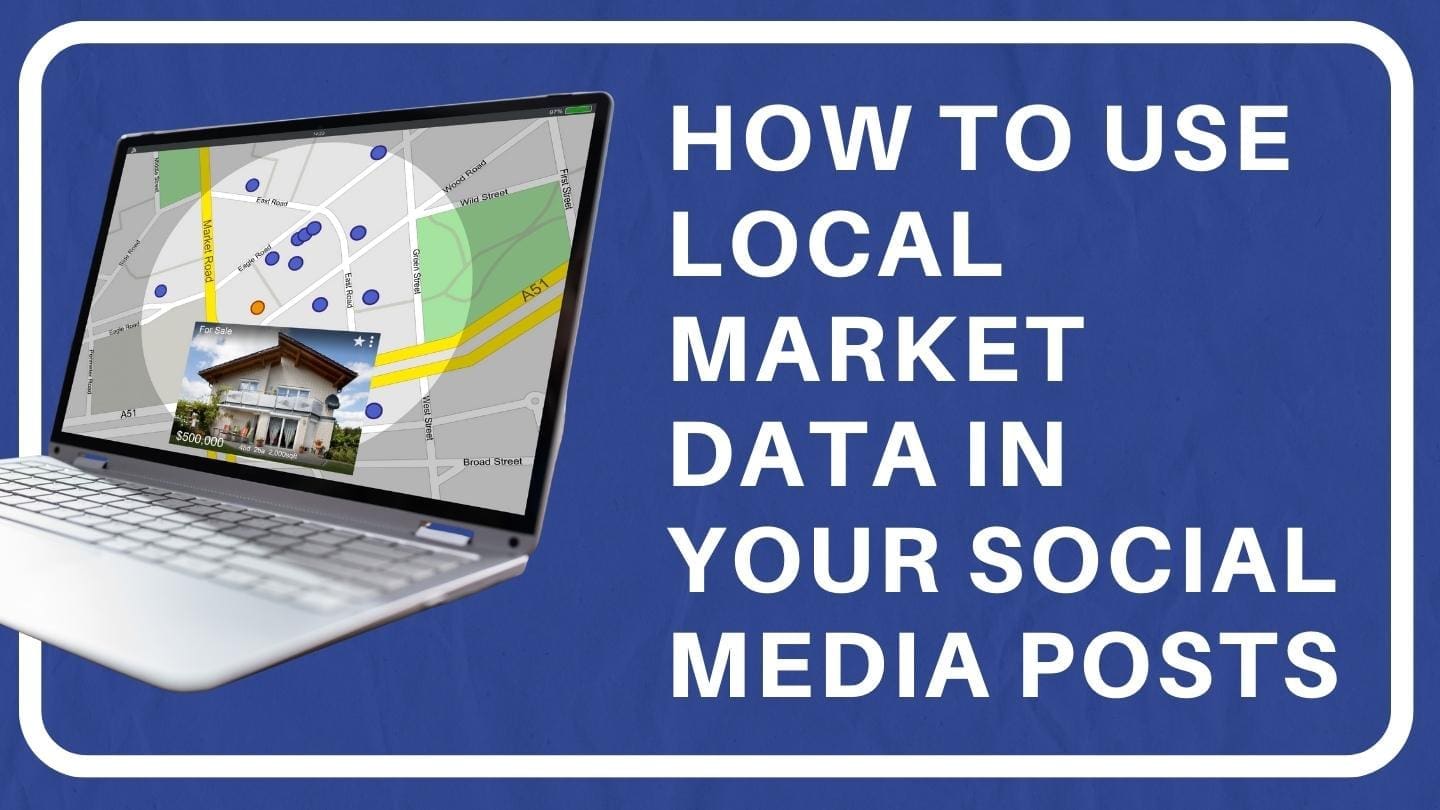
How to Use Local Market Data in Your Social Media Posts
Local market data makes your posts useful, trusted, and shareable. When you share facts about what is happening in your patch, people stop scrolling and start paying attention. This guide shows how to pick the right numbers, turn them into simple posts, and build a repeatable weekly and monthly routine.
Why local market data works
It answers the questions buyers, sellers, and landlords ask every day
It builds trust because facts feel safe and solid
It shows you know the streets, not just the headlines
It turns casual followers into warm leads who message you for advice
The core numbers to share and how to explain them
Keep the numbers simple. Use one or two at a time. Always add a short plain English line.
Median sale price
The middle sale price. Half the homes sold for more and half for less.Days on market
The average number of days it takes to sell a home.Auction clearance rate
The share of auctions that sold. A higher number means stronger buyer demand.New listings and total listings
How many homes came to market this week and how many are for sale in total. Low supply can lift prices.Vendor discount
The average discount from the first advertised price to the final sale price.Price change over 3 months and 12 months
Use percentages and a short note about what it means for sellers and buyers.Rental vacancy rate
The share of rentals that are empty. Low vacancy means strong demand from tenants.Gross rental yield
Annual rent as a percentage of the property price. Helpful for investors.Popular price bands
The price ranges with the most buyer activity. This helps sellers set strategy.
How to make numbers easy to read
Use one big headline number and one useful sentence
Keep captions to 3 short lines before the “see more” break
Always show the time period and the suburb
Round numbers to whole numbers where possible
Use the same colours and layout each week so people learn your style
Turning data into post formats that work
Use different formats through the week so your feed stays fresh.
Single stat tile
One number and one line. Example
Median Price in Carina this month 985k
More homes are selling in the 900k to 1.1m band.Two up comparison tile
This month versus last month. Use arrows and short labels.
Example
New Listings 38 up 12 percent
Days on Market 29 down 4 daysCarousel explainer
Slide 1 headline. Slides 2 to 5 one stat per slide. Last slide call to action.Short video or Reel
Fifteen to thirty seconds. Face to camera. One suburb. One message. One call to action.Stories with polls
Use a stat then ask a question.
Example
Vacancy rate 0.9 percent. Would you buy an investment here Yes or Not yetMap spotlight
A simple map with three suburbs marked with their median prices or days on market.
Ready to post caption templates
Copy, paste, and fill the blanks. Keep line breaks for readability.
Seller focused
Today’s snapshot for [Suburb]
Median sale price [Number]
Days on market [Number]
Buyers are strongest in the [Price Band] range
Thinking of selling in [Month] Let me show you where your home fits in this marketBuyer focused
Market check for [Suburb]
New listings this week [Number]
Auction clearance rate [Number] percent
If you want off market alerts in [Suburb] send me your budget and must havesInvestor focused
Rental update for [Suburb]
Vacancy rate [Number] percent
Median weekly rent [Number]
Gross yield [Number] percent
Ask for my five street list with the best rental demand right nowLandlord retention
Rents in [Suburb] moved [Up or Down] by [Number] percent over 12 months
Average days vacant between tenants [Number]
Want a free rent review for your property Reply with your address
Simple scripts for Reels and Lives
Keep your phone at eye level. Speak slowly. Smile. End with a clear action.
Fifteen second suburb update
Quick check on [Suburb] this week. Median price is [Number]. Days on market is [Number]. Buyer interest is strongest around [Price Band]. If you want a price guide for your home, comment Guide and I will DM it.Thirty second investor check
Investors keep asking about cash flow in [Suburb]. Vacancy is [Number] percent. Median rent is [Number] a week. Gross yield sits at [Number] percent. If you would like a list of high demand streets, send me the word Investor.
Your weekly data routine
A simple routine keeps you consistent. Batch it once and you can post all week.
Monday
Single stat tile for your main suburb
One line insightTuesday
Carousel with four quick stats across nearby suburbsWednesday
Story poll based on one number
Add a question sticker for follow upThursday
Short Reel with your voice and one chart on screenFriday
Price band spotlight
Show where most buyers are active this weekSaturday
Open home wrap in Stories
Number of groups, common questions, next stepsSunday
Quiet day or a community post with one soft stat like average days on market
Your monthly wrap system
Set a calendar reminder on the first day of the month. Prepare one high value post and one video.
One page graphic
Five numbers from the last month for [Suburb]
Median price, days on market, new listings, clearance rate, rent growthTwo minute video
What moved the needle this month
Who this market favoured
What to watch next month
Clear call to action for appraisals or buyer briefings
Design tips so your data looks premium
Use one brand colour and one neutral
Keep plenty of white space
Use the same font for numbers each week
Put suburb and period in the same place on every graphic
Make the headline number at least three times larger than the body text
Add your logo and contact details in the bottom corner
Save posts as square for feed and nine by sixteen for Stories and Reels
How to add context that people care about
Numbers alone can feel cold. Add small human details.
Translate a number to a real world outcome
Days on market down four means sellers are reaching moving day soonerAdd a buyer or tenant story
Three offers this week between 950k and 1.05m shows demand in that bandConnect to seasons and events
Spring stock is rising so early bird sellers often win
Compliance and trust notes
Keep trust high. Make it easy for people to see what the numbers mean.
Always include the time period and suburb
Add a short source note or say sourced from market data on request
Avoid promises or guarantees
Use words like may, can, and likely when you project
Keep private data private in all screenshots and videos
Update or remove posts if the numbers change in a big way
Turning comments and DMs into leads
Plan your next step before you post.
Add a simple call to action
Comment Guide for a suburb price guide
Message Rent for a free rent review
Reply Market for a three minute property checkHave a ready response saved in your notes
Thanks for asking for the [Item]. What is your address and best email I will send it now.Tag and save your warm leads
Use a spreadsheet or your CRM to track who asked for what and when to follow up
A seven day content planner using local data
Day 1
Tile. Median price for [Suburb]. One line insight.Day 2
Carousel. Four nearby suburbs with days on market.Day 3
Story. Poll. Would you sell if you had a buyer at [Price] Yes or Not sureDay 4
Reel. Your face. Clearance rate and what it means this week.Day 5
Feed post. Top three price bands with most buyer activity.Day 6
Stories. Open home numbers and common buyer questions today.Day 7
Video. Thirty second weekly wrap with a simple action.
How to measure what is working
Track results for 30 days. Adjust based on real numbers.
Reach
Which post format carries your message the furthestSaves and shares
Data posts should attract saves and shares more than averageDMs and form fills
Count how many people ask for guides or appraisalsListing and management leads
Tag the source in your CRM. Review monthly.
Fast creation checklist
Use this checklist each week so you can create in one session.
Confirm your suburbs of focus
Pull five core stats for each suburb
Choose three post formats for the week
Write one sentence insight for each post
Design one master tile then duplicate
Record one short video with the key change
Load all posts into your scheduler with calls to action
Save replies for common DMs
Common mistakes to avoid
Posting too many numbers in one graphic
Forgetting to show the time period or suburb
Using old data without a note
Making big claims without context
Skipping the call to action
Changing your layout every week so followers cannot learn your style
Local market data is your edge. Share one clear number, add one helpful line, and connect it to a next step. Do it every week. Over time your audience will see you as the trusted guide in your patch and will reach out when they are ready to move.
Author Ken Hobson
ken@agentslibrary.com.au

Industry Tech & Ai Newsletter